This is the ‘PuOr’ palette from https://colorbrewer2.org/. It has at most eleven colors.
Details
This is similar to sequential_pal(), but it also puts
emphasis on the mid-range values, plus the the two extreme ends.
Use this palette, if you have such a quantity to mark with vertex
colors.
See also
Other palettes:
categorical_pal(),
r_pal(),
sequential_pal()
Examples
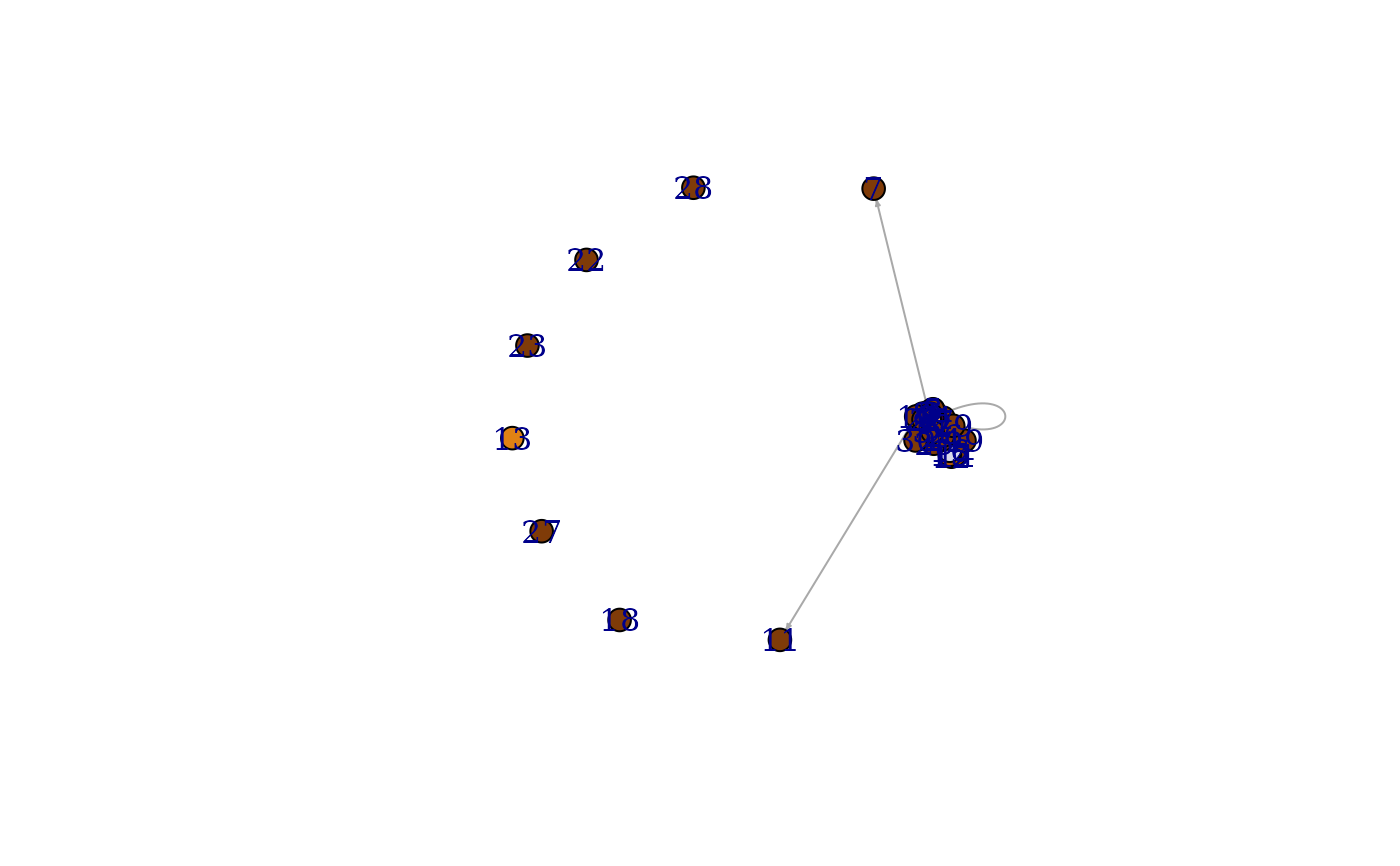
library(igraphdata)
data(foodwebs)
fw <- foodwebs[[1]] %>%
  induced_subgraph(V(.)[ECO == 1]) %>%
  add_layout_(with_fr()) %>%
  set_vertex_attr("label", value = seq_len(gorder(.))) %>%
  set_vertex_attr("size", value = 10) %>%
  set_edge_attr("arrow.size", value = 0.3)
#> This graph was created by an old(er) igraph version.
#>   Call upgrade_graph() on it to use with the current igraph version
#>   For now we convert it on the fly...

V(fw)$color <- scales::dscale(V(fw)$Biomass %>% cut(10), diverging_pal)
plot(fw)


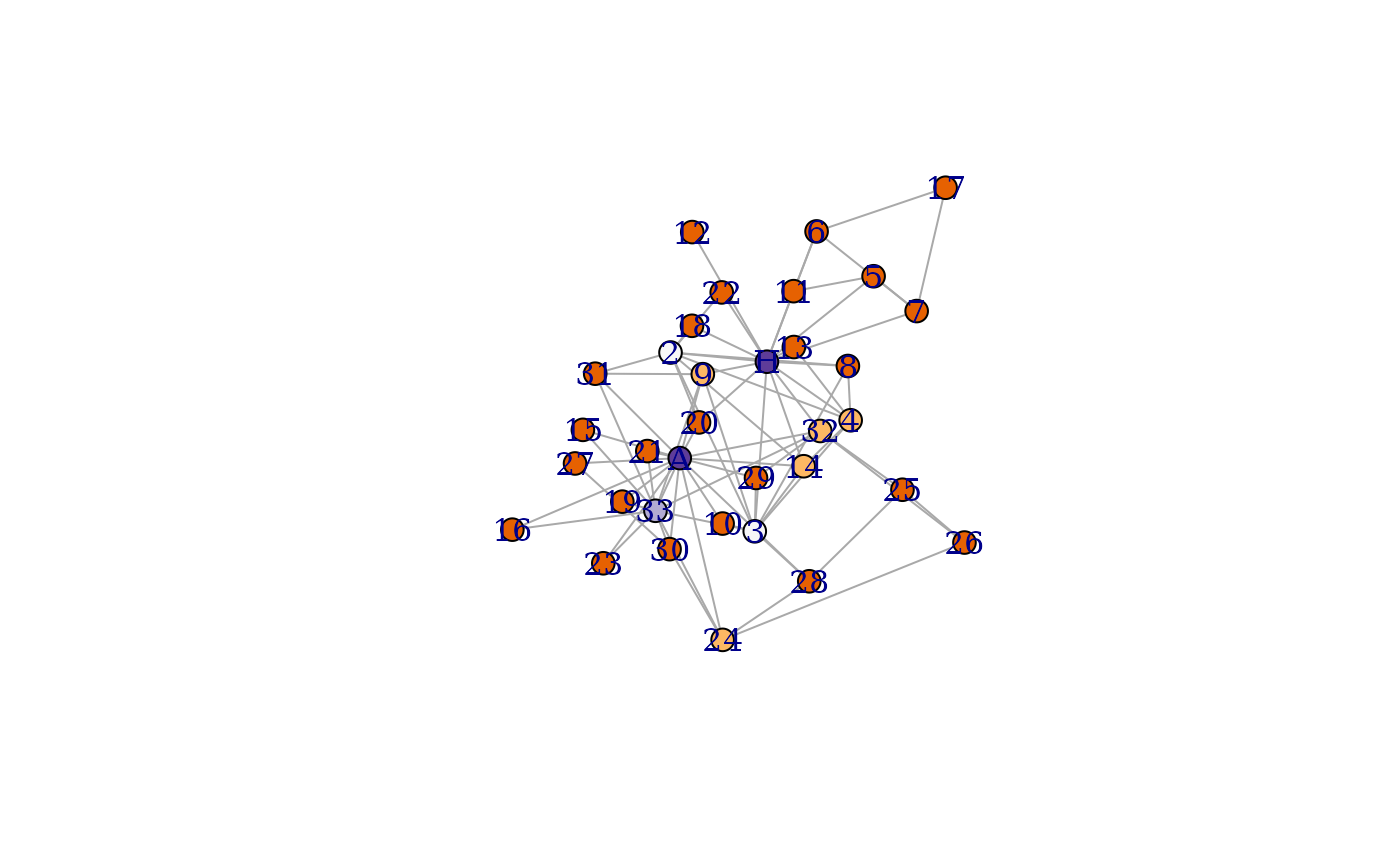
data(karate)
karate <- karate %>%
  add_layout_(with_kk()) %>%
  set_vertex_attr("size", value = 10)
#> This graph was created by an old(er) igraph version.
#>   Call upgrade_graph() on it to use with the current igraph version
#>   For now we convert it on the fly...

V(karate)$color <- scales::dscale(degree(karate) %>% cut(5), diverging_pal)
plot(karate)
